So much for the Tesla killers
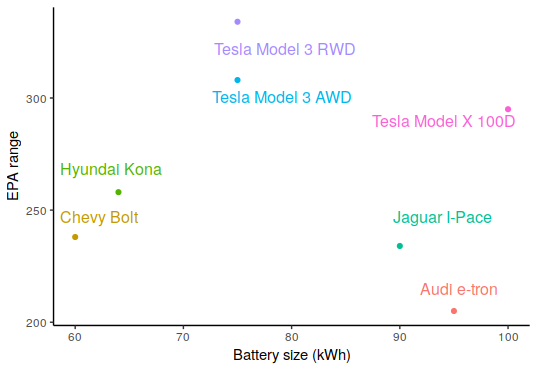
The new Audi and Jaguar electric cars (or crossovers or whatever) both have EPA ranges under 250 miles, which is disappointingly low, at least for the US market. (The Audi’s EPA range isn’t out yet but this Car and Driver article says it will be just over 200 miles.) For comparison, here are a bunch of electric cars—a few of which have been on the market for years now—their range, and battery size, which shows that sheer battery size isn’t at all the issue:
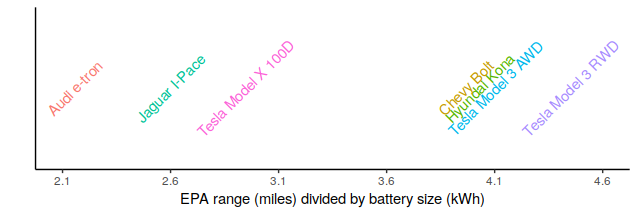
Here’s just the range divided by battery size which is probably clearer. It’s hard not to conclude the Tesla has a true technological advantage, maybe in battery or motor efficiency or car shape or all three, though other factors could be at play as well (more conservative use of battery capacity? prioritization of charging time over range?).
The idea of the “Tesla killer” was that as soon as the luxury automakers got their act together, they would offer electric cars equivalent to Tesla in the basic technology (range and so forth) and far superior in other respects (build quality, luxuriousness, etc.). However it appears that the first part of this proposition has not been realized.
Chart code, click to expand
library(ggplot2); theme_set(theme_classic()); library(directlabels)

EVs=read.csv(text = "Car,                EPA.range,     Battery.size
Jaguar I-Pace,      234,           90.0
Audi e-tron,        205,           95.0
Tesla Model X 100D, 295,           100.0
Hyundai Kona,       258,           64.0
Chevy Bolt,         238,           60.0
Tesla Model 3 AWD,  308,           75.0
Tesla Model 3 RWD,  334,           75.0
", sep=",", strip.white=T)

direct.label(ggplot(data=EVs, aes(y=EPA.range, x=Battery.size, color=Car)) + geom_point() +
xlab('Battery size (kWh)') + ylab('EPA range') + guides(color=FALSE))

EVs$ratio = EVs$EPA.range / EVs$Battery.size

ggplot(data=EVs, aes(x=ratio, y=rep(" ",nrow(EVs)), color=Car, label=Car)) +
geom_text(angle=45) +   xlab("EPA range (miles) divided by battery size (kWh)") +
theme(axis.ticks.y = element_blank(), legend.position="none") + ylab("") +
scale_x_continuous(limits=c(2.1, 4.6), breaks=seq(2.1, 4.6, by=0.5))